Every business talks about data. Most even collect tons of it — clicks, sales, app events, customer chats — but when it comes to actually using that data while it’s still relevant, things usually fall apart. By the time yesterday’s report loads, the moment that mattered is already gone.
That’s why a modern streaming analytics platform feels like a superpower. It doesn’t wait for spreadsheets to fill up. It watches your data as it moves, catching patterns the instant they appear. Banks flag suspicious activity right as it happens. E-commerce sites adjust prices before competitors do. Streaming services learn what people want to watch before the credits roll.
This shift is massive. Analysts expect the streaming analytics market to top $80 billion by 2028, and it’s easy to see why. The speed of decision-making has become a competitive edge. Those who act on fresh data win. Those who don’t, react too late.
In the sections ahead, we’ll unpack what makes streaming analytics tick, explore the top tools shaping the field, and see how Scrile Stream helps companies build custom, intelligent systems that grow as fast as their data does.
What Is a Streaming Analytics Platform?
When people hear “analytics,” they often imagine dashboards full of graphs that update once a day. That’s the old model — data collected, stored, and reviewed long after the action is over. A streaming analytics platform flips that idea completely. It doesn’t wait for data to rest. It listens while the data moves.
In simple terms, it’s a system that processes and analyzes information the moment it’s created — sensor readings, transactions, app clicks, video streams, or user behavior — all happening in motion. This approach, known as streaming data analytics, helps companies react in real time instead of playing catch-up.
Think of the tools behind it as a live nervous system for your business. Real-time data analytics tools and real time analytics software collect signals from multiple sources, filter them, and deliver insights instantly. Instead of waiting for a scheduled report, teams see what’s happening as it happens — and that changes everything.
Here’s what a typical setup can do:
- Collect data from dozens of live sources — websites, IoT devices, apps, payment systems.
- Process and clean it in milliseconds using stream processors like Apache Kafka or Flink.
- Analyze it through machine learning models or business rules.
- Act on insights instantly — trigger alerts, adjust campaigns, or display results on live dashboards.
Imagine a retail chain running a flash sale. A streaming system tracks which products are selling fastest and adjusts prices on the fly. Or a live video platform spotting lag in a broadcast and rerouting traffic before viewers even notice.
These systems form the backbone of real-time business decisions — from logistics and fraud detection to entertainment and digital advertising — giving companies the speed and accuracy that traditional analytics simply can’t match.
Key Capabilities of Streaming Analytics Platforms
To understand what makes a solid streaming analytics platform, you have to look at how it handles pressure. Imagine data arriving non-stop — sensor readings, clicks, payments, video frames — all at once. The platform’s job is to keep that stream moving, make sense of it, and hand back something useful before it’s too late.
These are the parts that matter most:
- Real-time ingestion. Systems like Timeplus can take in roughly ten million events each second. That kind of flow is what keeps live dashboards from freezing and alerts from lagging.
- Low latency analytics. Some platforms finish their calculations in about four milliseconds. At that speed, the response feels immediate.
- Scalability. When traffic suddenly multiplies — say, during a product launch or a sports broadcast — the system spreads the load across more machines without interrupting the feed.
- Integration flexibility. Many companies already use tools such as Kafka, Redpanda, Flink, or Spark. A good platform plugs into those with standard APIs instead of forcing new workflows.
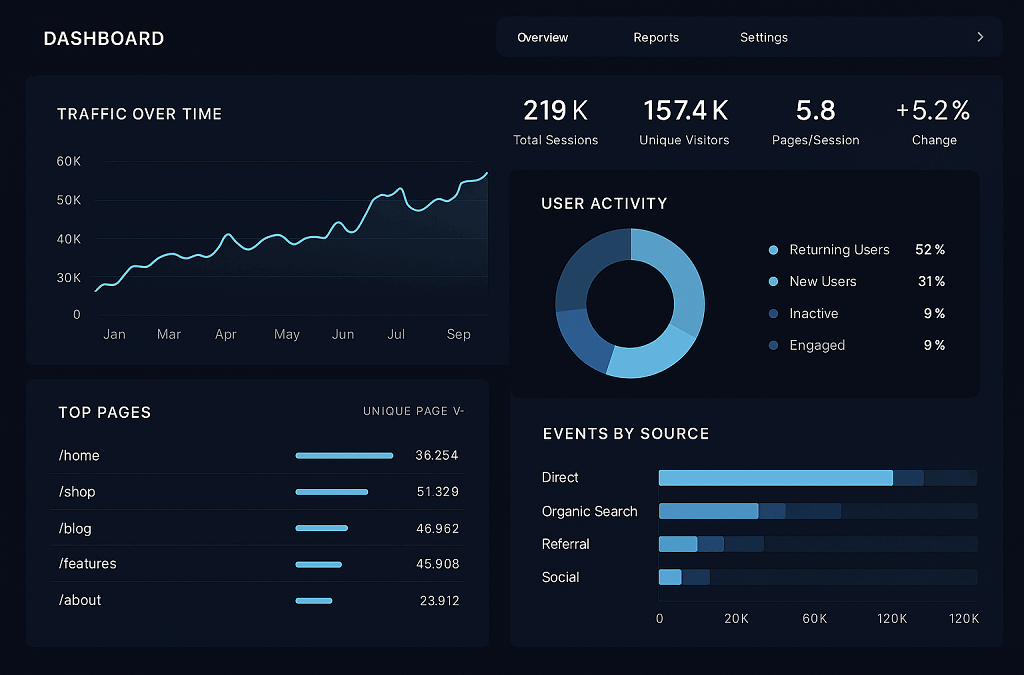
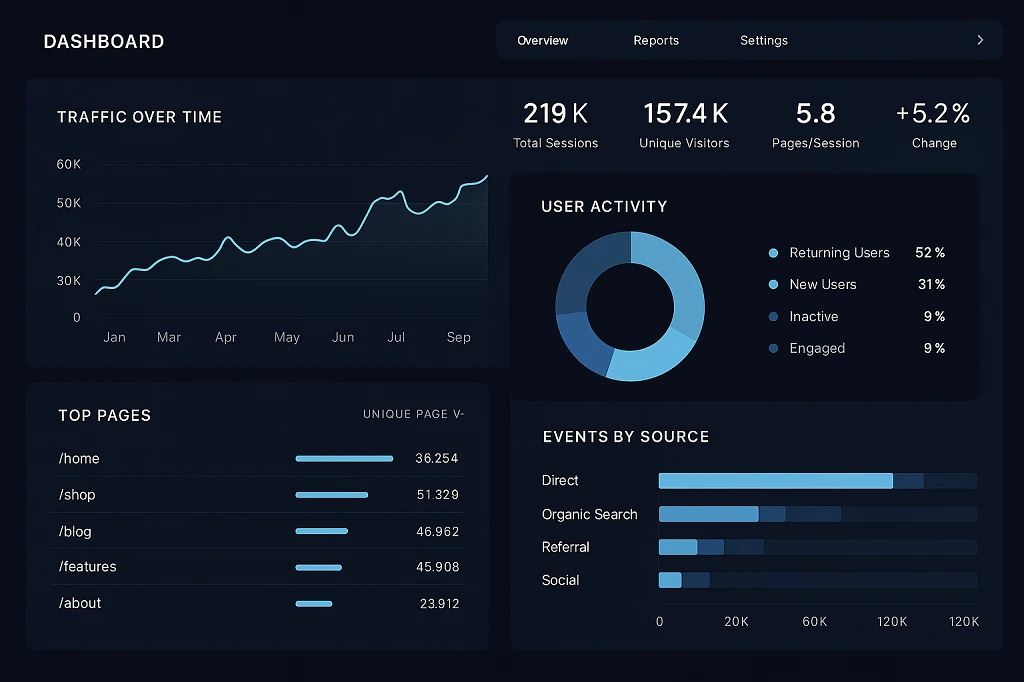
- Visualization and insights. Raw numbers aren’t helpful until people can read them. Clear dashboards or live alerts show what’s happening as it unfolds.
- Fault tolerance. Hardware breaks, networks drop. The software needs to recover on its own and keep processing the rest of the stream.
Together, these features make up the quiet machinery behind real-time data analytics tools used in streaming services, trading systems, and IoT networks. They let businesses see the state of things as it is right now, not as it looked an hour ago.
Top Streaming Analytics Tools to Know in 2026
Below are the leading platforms in real-time data analytics, each known for distinct strengths, real-world use, and measurable performance.
Apache Kafka
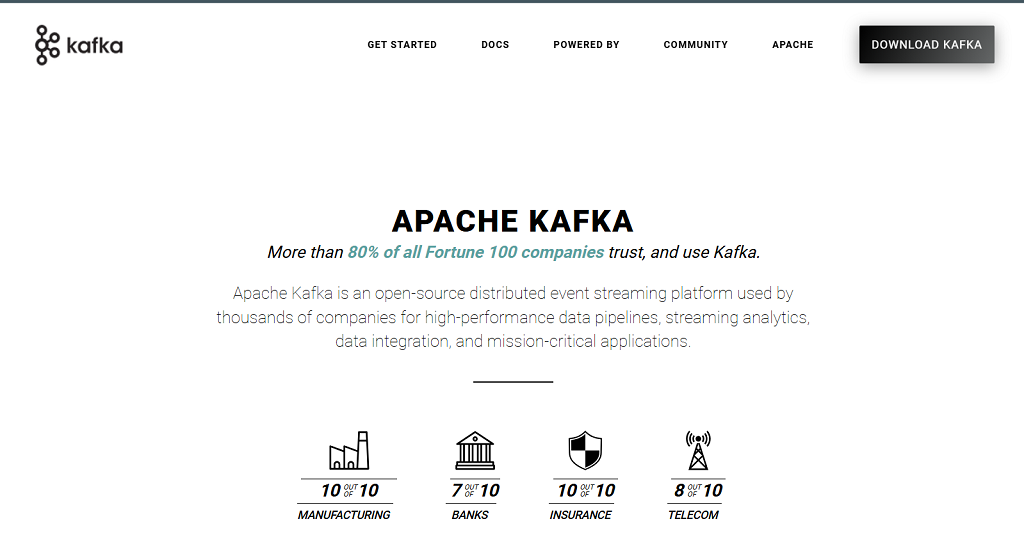
Apache Kafka sits at the heart of many modern data architectures. It’s an open-source framework designed for high-throughput pipelines — the invisible backbone that moves data from one system to another in real time. Companies like Netflix, Uber, and LinkedIn depend on Kafka to power continuous event streams that feed everything from recommendations to billing systems.
Pros:
- Handles millions of messages per second without breaking.
- Integrates smoothly with Apache Flink and Spark, forming complete streaming analytics pipelines.
- Backed by a massive community and a rich ecosystem of connectors.
Cons:
- Requires strong technical expertise to maintain and scale.
- Doesn’t include built-in visualization or analytics out of the box — it’s a transport layer, not a dashboard tool.
In short, Kafka isn’t flashy, but it’s foundational. For many teams, it’s the first building block when constructing a streaming analytics platform capable of handling massive data movement with minimal delay.
Apache Flink
If Kafka moves data, Apache Flink makes sense of it. This open-source engine handles both stream and batch processing, meaning it can analyze real-time flows while still managing historical data. It’s favored for complex event processing — things like monitoring user behavior or detecting trends as they happen.
Pros:
- Extremely low latency; results can appear in milliseconds.
- Works seamlessly with Kafka, providing a complete streaming data analytics stack.
- Supports SQL-like queries, making it more accessible to analysts without heavy coding skills.
Cons:
- Can be challenging to deploy and tune for beginners.
- Resource-heavy when running at scale.
Alibaba uses Flink as part of its real-time recommendation engine, processing billions of interactions daily. For businesses that want flexible, real-time pipelines and strong developer control, Flink remains one of the most capable real-time analytics tools available.
Timeplus
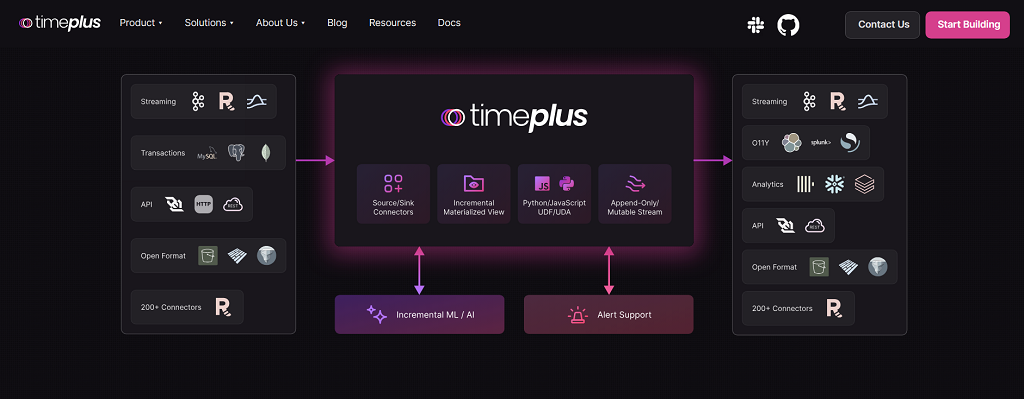
Timeplus represents the newer generation of cloud-native platforms built specifically for real time data analytics tools. It’s designed around speed — not theoretical speed, but numbers you can measure. The platform supports up to 10 million events per second with an average 4 millisecond latency. That’s fast enough for use cases like monitoring financial transactions, IoT sensors, or live user metrics.
Pros:
- Ultra-low latency and massive throughput.
- User-friendly interface and SQL-compatible querying.
- Built-in dashboards for instant visualization.
Cons:
- Relatively young ecosystem compared to Kafka or Flink.
- Works best in cloud environments; on-prem setups may need adjustments.
Timeplus fits teams that want instant insights without wrestling with heavy infrastructure. It’s a tool that trades complexity for speed, giving engineers and analysts real-time visibility without layers of setup.
Memgraph
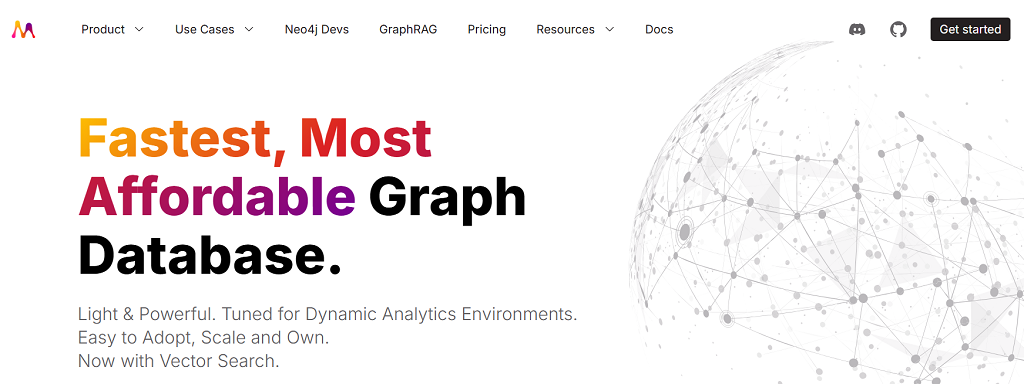
Memgraph goes a different way when it comes to real-time processing. It doesn’t consider data as a uniplex stream of records but models relationships — relationships between users, for instance, or between devices or events. This makes it a good option for companies where the context is critical even when the speed is. Social apps, delivery services, and banks employ it to discover patterns locked inside gigantic streams of data.
Pros:
- Built for graph-based streaming analytics, perfect for tracking relationships and dependencies.
- Integrates with Kafka for live data ingestion and transformation.
- Excellent for use cases like fraud detection, logistics optimization, or social network analysis.
Cons:
- Requires understanding of graph data modeling.
- Smaller developer community compared to older open-source giants.
A simple example: a bank streaming thousands of transactions per second can use Memgraph to spot suspicious behavior — same card, different locations, same minute — before the system flags it later. That kind of streaming analytics platform capability saves both money and trust.
Google Cloud Dataflow
Google Cloud Dataflow sits inside the broader Google Cloud ecosystem, designed for teams already using tools like BigQuery or Pub/Sub. It’s a managed service that takes care of scaling, maintenance, and infrastructure — meaning engineers can focus on writing processing logic instead of building servers.
Pros:
- Fully managed — no infrastructure setup or scaling headaches.
- Deep integration with BigQuery and Looker for visualization.
- Ideal for large-scale data transformation and ETL pipelines.
Cons:
- Less flexible outside Google’s ecosystem.
- Can get expensive at high throughput levels.
For enterprises handling global-scale workloads, Dataflow’s reliability and automation make it a favorite. It’s particularly strong for cloud-native companies that need consistent streaming data analytics without the operational overhead.
Amazon Kinesis
Amazon Kinesis is Amazon’s long-standing answer to real-time streaming analytics. It connects directly with AWS services like Lambda and Redshift, making it easy to trigger events, process data, or push insights into dashboards. It’s widely used for log monitoring, app telemetry, and customer behavior analytics.
Pros:
- Seamless integration within AWS.
- Supports hundreds of thousands of simultaneous streams.
- Highly reliable and secure.
Cons:
- Tied closely to Amazon’s cloud — migration elsewhere can be tricky.
- Some latency overhead for complex pipelines.
Kinesis works well for companies already in the AWS environment that want real time analytics software baked into their existing infrastructure. It’s dependable, enterprise-ready, and proven at scale.
Estuary Flow
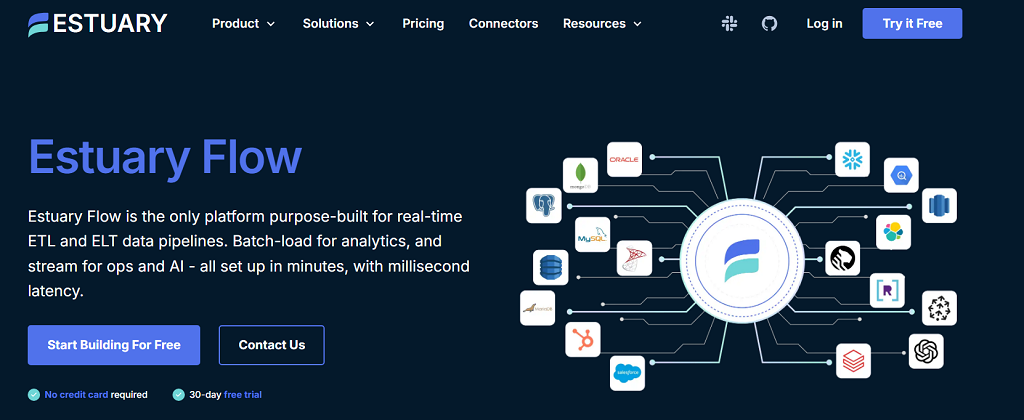
Estuary Flow belongs to a new generation of streaming analytics tools that focus on usability and speed of deployment. It bridges the gap between engineering-heavy systems like Kafka and plug-and-play data integration tools. Flow allows businesses to connect data sources, transform them on the fly, and push them into analytics dashboards without building pipelines from scratch.
Pros:
- Simple interface — built for teams without large data engineering staff.
- Works across multiple cloud environments and databases.
- Strong for real-time syncing between SaaS platforms and internal systems.
Cons:
- Limited customization for deep, complex pipelines.
- Still expanding its list of supported integrations.
For teams that want quick, reliable live data movement — think marketing analytics, app telemetry, or CRM updates — Flow offers a way to get real-time visibility without heavy infrastructure. It’s a practical entry point into streaming data analytics, especially for companies scaling fast but not yet ready for enterprise-level setups.
Real-World Use Cases & Business Benefits
Different companies use a streaming analytics platform for different things, but the idea stays simple: act while the data is still fresh.
An online store watches what people click and buy. Prices can shift during the same visit, not the next day. A bank sees money moving between accounts and freezes a suspicious transfer before it clears. A factory reads temperature and vibration from its machines and slows production before something breaks.
Then there are creators. Streaming data analytics gives them a live look at their audience — who’s watching, when they leave, which moments get reactions. Streamers or educators can adjust mid-session, change topics, or pace content differently because they see what connects in real time.
These small shifts matter. Companies using real time analytics tools report faster decision cycles and noticeably less downtime. It’s the kind of improvement that compounds: smoother systems, fewer surprises, and teams that respond instead of react. When a business reaches the point where ready-made dashboards feel too tight, custom systems start to make sense — tools that match how it actually works, not how a vendor thinks it should.
Streaming Analytics in Video and Creator Platforms
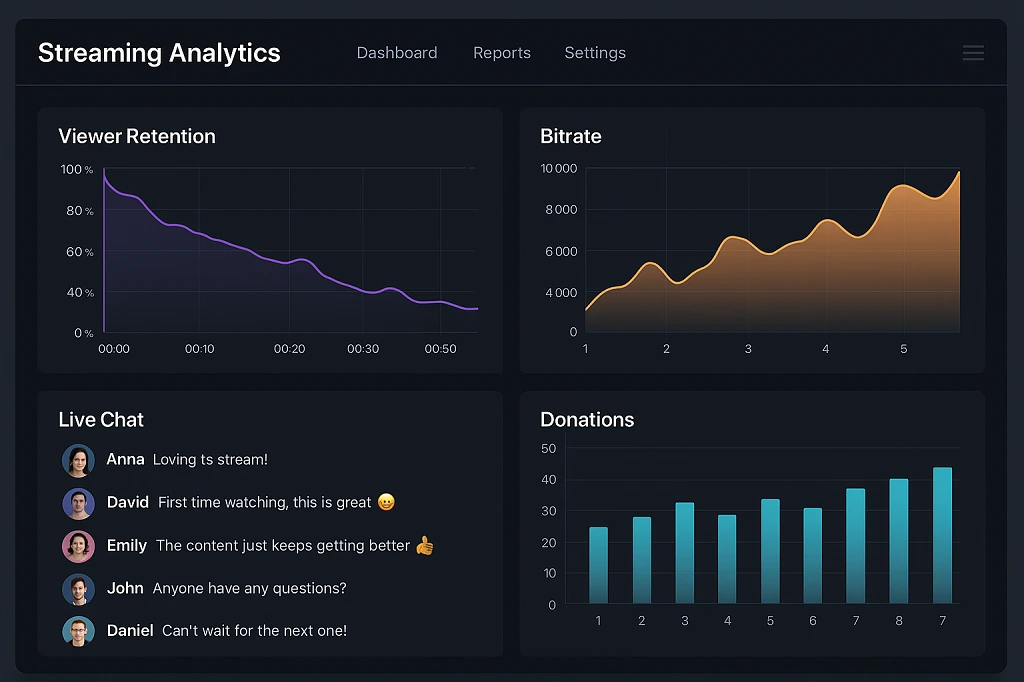
In live streaming, analytics isn’t a report you open the next morning. It’s part of how the stream runs. A streaming analytics platform keeps track of what’s happening on screen and behind it — the connection quality, the chat, the audience flow.
For video platforms, the data comes in waves. Bitrate, latency, and buffering are watched every few seconds. When something slips, the system reroutes or balances traffic before people start complaining about lag. Engineers see the health of every stream as it happens.
Creators look at a different kind of signal. Streaming data analytics shows when viewers join, when they drop off, and which moments spark activity in chat. Some track donations or purchases the same way — second by second. Those patterns shape what happens next: a change in topic, a shout-out, or a switch in camera view.
It’s simple but powerful. Real time analytics tools let streamers and platforms notice small things quickly — a lag, a trend, a reaction — and do something about it while the show is still on.
Build Your Own Custom Streaming Solution with Scrile Stream
At some point, every platform hits the same wall — off-the-shelf tools stop fitting. Metrics feel generic, integrations start breaking, and you need something that works the way your audience behaves, not how a vendor imagined it. That’s where Scrile Stream makes sense.
Scrile Stream isn’t a plug-and-play app. It’s a development service that helps you build a streaming system from the ground up, including analytics designed specifically for your business model. You decide what matters: audience retention graphs, chat sentiment, payment events, or stream quality reports. Their engineers make it work exactly that way.
What Scrile Stream brings to the table:
- Ownership. The code, data, and design belong to you. Nothing is locked behind someone else’s server.
- Integration. It connects directly to your existing analytics stack or creates a new one built on real-time analytics software and streaming analytics tools.
- Customization. The interface and dashboards follow your brand and workflow — not a preset template.
- Scalability. The system handles thousands of live viewers and interactive sessions without slowing down.
Think of a learning or creator platform built this way. You can see viewer engagement, bitrate health, and revenue activity in real time — all inside one branded dashboard. The result isn’t just another website; it’s a complete, data-driven environment that grows with your business.
For teams that want to stop patching together third-party apps and start building real control into their product, Scrile Stream offers both the expertise and the foundation to make it happen.
Conclusion
Modern companies can’t afford to wait on yesterday’s numbers. Decisions have to move as fast as the data itself. A well-built streaming analytics platform gives that speed — tracking, learning, and reacting as information flows in.
Tools like Kafka, Flink, and Timeplus set a strong foundation, but true flexibility comes from systems built specifically for the business using them. Custom development keeps ownership, control, and scalability in your hands.
If you’re ready to go beyond rented tools and dashboards, contact the Scrile Stream team. They’ll help you design a custom streaming solution with analytics that move as quickly as your business does.
FAQ
What is streaming analytics?
Streaming analytics means analyzing data the moment it appears instead of waiting for it to pile up. It’s built for real-time decisions — processing small packets of information like sensor readings, transactions, or user clicks as they happen. Businesses use it to catch patterns instantly and respond without delay.
What is a streaming data platform?
A streaming data platform manages nonstop flows of information coming from many different sources. It pulls data in, processes it, and pushes out results with almost no delay. The goal is to keep insights current — useful in finance, IoT, or media where seconds matter.
Which database is best for streaming data?
Apache Kafka remains the go-to choice for fast and reliable data streams. It scales easily, supports real-time analytics pipelines, and connects smoothly with tools like Flink or Spark for deeper analysis.